
- Home
- Premium Memberships
- Lottery Results
- Forums
- Predictions
- Lottery Post Videos
- News
- Search Drawings
- Search Lottery Post
- Lottery Systems
- Lottery Charts
- Lottery Wheels
- Worldwide Jackpots
- Quick Picks
- On This Day in History
- Blogs
- Online Games
- Premium Features
- Contact Us
- Whitelist Lottery Post
- Rules
- Lottery Book Store
- Lottery Post Gift Shop


The time is now 12:28 am
You last visited
May 2, 2024, 11:33 pm
All times shown are
Eastern Time (GMT-5:00)

"A Pretty Stunning Graph of World Cement Production (and China is Certainly Using It)
Published:
Updated:
Read a few years back China was buying most of the world's cement due to their building boom. Now hard data, great article excellent graphs.
_______
"A Pretty Stunning Graph of World Cement Production (and China is Certainly Using It)
Posted by Prof. Goose on June 20, 2008 - 6:00am
Topic: Economics/Finance
Source The Oil Drum
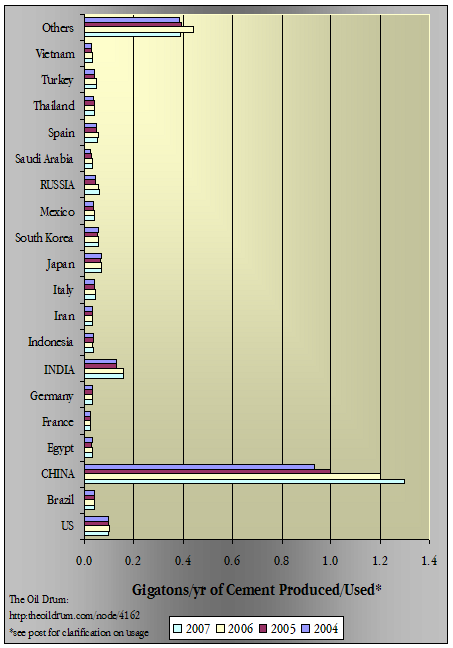
Annual production of cement by country in billions of metric tons. Click to expand. Source: USGS 2006 report (PDF) and the USGS 2008 report (PDF).
Cement is mainly used to make concrete, and is sort of the "active ingredient" in concrete - it is combined with sand and gravel in roughly fixed proportions. So cement production can be considered a rough proxy for the total amount of construction going on in a country.
This post updates Stuart's post about this two years ago (and yes, it's still a graph that will blow you away!) with two more years of USGS cement data, 2006 and 2007. The growth in China, from 1 GT to 1.3 GT in two years is mindboggling, even India and Russia are interesting...and there's more to think about under the fold.
edited to add: As a couple of folks pointed out--I have interchanged "production" and "usage" in this post incorrectly--however, China's 2007 cement exports were only 33 million tons out of 1.3 billion tons produced. So, at least for China, production is a good proxy for demand/consumption. My apologies for the mistake.
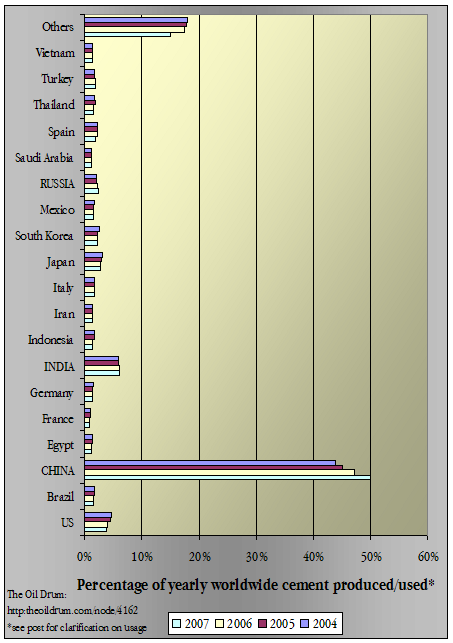
Percentage of yearly worldwide cement usage. Click to expand. Source: USGS 2006 report and the USGS 2008 report.
Some things we learned from the comment thread from Stuart's post a couple of years ago:
Remember, in China, oil isn't used in cement production. In the "clinker" stage, it's all coal. In the blending stage it's electricity (which is generated 80% from coal in China).
And cement production in China is inefficient. There are hundreds of small plants, both wet and dry processes, and the local environmental impact is severe.
Making a pound of cement releases a pound of CO2. And a Gigaton or two?
This also isn't a new phenomenon. This link shows data back to 1999 that illustrated that China has been at this for quite a while, but perhaps not to this extent.
To conclude, here is the percent change of production bar graph from 2005 to 2008. Think about what all that means in terms of energy. Also note the numbers from India, Russia, and the US.

Percentage growth in cement consumption 2005-2008. Click to expand. Source: USGS 2006 report and the USGS 2008 report.
Comments
This Blog entry currently has no comments.
Post a Comment
Please Log In
To use this feature you must be logged into your Lottery Post account.
Not a member yet?
If you don't yet have a Lottery Post account, it's simple and free to create one! Just tap the Register button and after a quick process you'll be part of our lottery community.
Register