
- Home
- Premium Memberships
- Lottery Results
- Forums
- Predictions
- Lottery Post Videos
- News
- Search Drawings
- Search Lottery Post
- Lottery Systems
- Lottery Charts
- Lottery Wheels
- Worldwide Jackpots
- Quick Picks
- On This Day in History
- Blogs
- Online Games
- Premium Features
- Contact Us
- Whitelist Lottery Post
- Rules
- Lottery Book Store
- Lottery Post Gift Shop


The time is now 8:51 pm
You last visited
July 24, 2026, 10:22 am
All times shown are
Eastern Time (GMT-5:00)

"Six Million Home Foreclosures: Are FDIC Insured Banks the Next Time Bomb? (Part 1)
Published:
Six Million Home Foreclosures: Are FDIC Insured Banks the Next Time Bomb? (Part 2)
http://seekingalpha.com/article/159368-six-million-home-foreclosures-are-fdic-insured-banks-the-next-time-bomb-part-2
_________
September 01, 2009
"Over a year ago Hank Paulson declared "The US Banking System Is A Safe and Sound One", the market's reaction to that piece of news was to short Fannie (FNM) and Freddie (FRE) into oblivion. A key issue there was holdings of mortgaged backed securities, specifically RMBS; valuations of those things depended on (a) their credit rating, (and once the LTV started to slip the rules said they had to be downgraded, so the price tanked), and (b) there was a rule of thumb that the value of those things was what an equivalent Treasury cost, less the cost of a CDS to insure them; when fear took over, the cost of a CDS went through the roof, the "market" (it never was a real market), froze. Then there was Lehman.
What drove that crisis was fear of the future, and the reason so much money was required to bail out the players ($2.7 trillion so far) was that previously if you had a "good credit score" you could borrow short-term Treasures, and buy an RMBS on 100% margin, and make a fortune; then the margins got called.
What happened was nothing different from a gambler going into a casino, borrowing from the house, using that money to bet on a "sure thing", and losing. Lucky for the gambler the "house" decided he was too big to fail - if you or I were to do something like that, we would be lucky to get away with a pair of broken legs.
Now the future is threatening to arrive:
There are two issues, (a) how much of that $2.7 trillion paid out mainly by the Fed (largely without any oversight by Congress) will get paid back, and (b) what's going to happen to the legacy banks who (then) had the luxury of being able to "take a view" on their portfolios of "originate and hold", and make a provision.
Right now the "reserves for losses" of FDIC insured banks is $211 billion on a portfolio of $7.625 trillion of loans and leases plus another $1.365 trillion of RMBS. In the circumstances that looks a tad light.
But the die is still rolling, and where it ends up will determine how much the "Too Big To Fail" card-sharks pay back, and how much of the $1.422 trillion of equity capital of the FDIC banks gets destroyed.
It's sometimes easy to forget that in this war the front line is foreclosures; although you wouldn't think that from the news. All you get is occasional pretty charts from the Mortgage Bankers Association with percentages (it's never quite clear of what), plus sound bites from the rating agencies like "the cure rate went down last month" or from RealtyTrac: "total filings went up last month".
From that trickle of managed, massaged and censored dispatches, it sounds suspiciously like somebody (or some-bodies), is trying to hide something.
Like a ticking bomb?
Perhaps the bottom in house prices was in May or perhaps there will be another leg down, but that's starting to be academic; a bottom is somewhere in the neighborhood. The story now is foreclosures; that's what drove house prices down to where they are now and that's what will keep them down. The acid on that cake and the nightmare for anyone in negative equity, is how many there will be by the time this is all over?
Since January 2005 over two million homes in USA have been foreclosed, that's about 1.7% of the total housing stock.
Many of those were family homes, so that's probably already directly affected about 3.5% of the American population.
This is the Bomb:
Right now in the USA there are over two million mortgages in either the first stage or the second stage of foreclosure; a large majority of those will end in foreclosure. At the current rate of "clearance" it will take two years for all of those to be processed.
And that's not counting new ones getting added to the pipeline at a rate of about 100,000 a month. That's clearly not something that anyone thought worth mentioning in the one hundred pages of turgid drivel "The Industry" shoveled out over the past three months; that I ploughed through to make sure I got it right (dear reader - just for you). And you wonder why there is a credit crunch?
The News Is, It Ain't Pretty
The headline data that is typically released, for example by RealtyTrac (i.e."360,000 Filings In July") is an aggregation that has to be disaggregated to make any sense of it, there are three stages:
- Stage 1: A notice of default is posted in the County Recorder's Office
- Stage 2: A Notice of sale is announced
- Final Stage: A public auction supervised by the trustee who transfers the deed.
The borrower can normally "cure" the process at any point, typically up to five days before the date of sale, although some mortgages give the lender the power to push through to disposal of the property as soon as the loan becomes delinquent. In most cases the process is non judicial and governed by the wording of the mortgage so there is no requirement to involve the Courts and the only option the borrower has to stop or delay the process is to pay up.
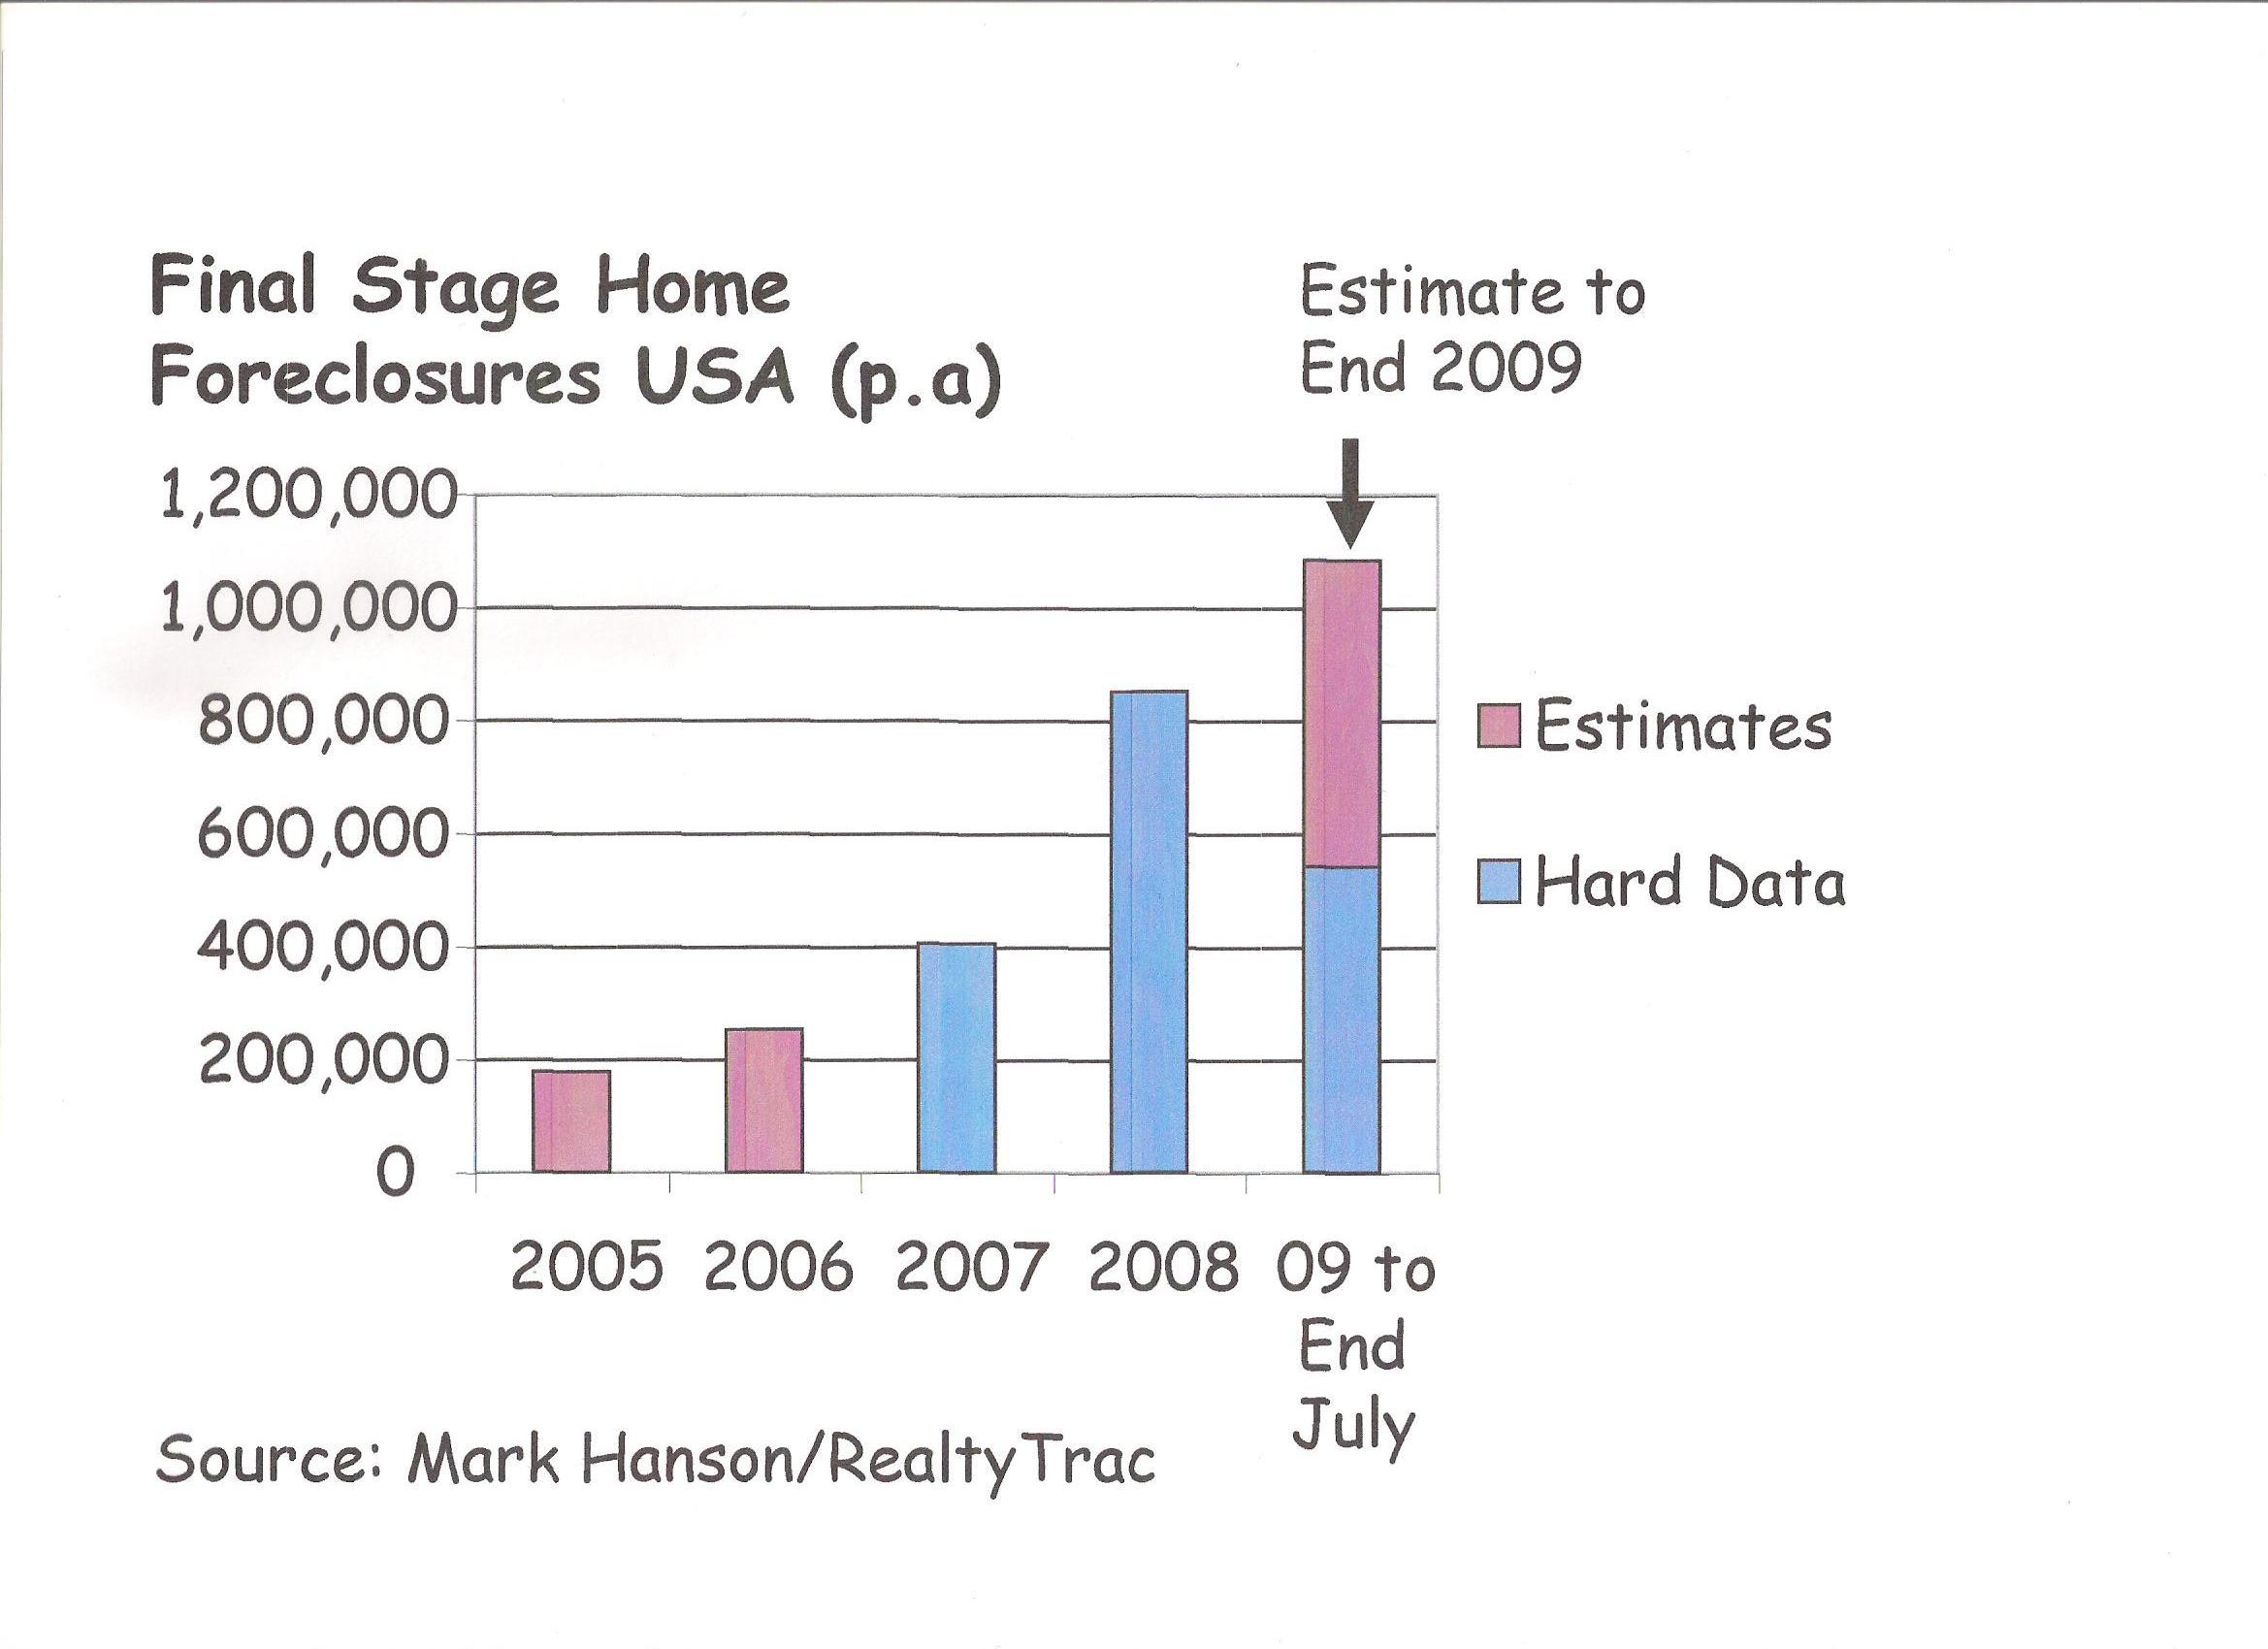
It's hard to get data, the best source I found was Mark Hanson plus there was data here and there from RealtyTrac. This is what I managed to cobble together:

That's not complete data, presumably that exists somewhere but it's not in the public domain. The reason there are more 1st Stage than 2nd Stage than Final Stage is (a) because some mortgages are cured (no hard data on how many) and (b) because the flow through from 1st to 2nd and Final is not linear.
An optimist might say that it looks like there is a top developing since Stage 1 and Final Stage are flattening; here are some theories:
- That could perhaps be due to the recent moratorium from Q-4 2008 through Q-2 2009; but perhaps all that did was increase the backlog, and cure rates for those are going down (according to Fitch).
- Another possible reason could be that the "system" just can't handle more than about 80,000 final foreclosures a month, perhaps that's about the limit. In 2005 the average was less than 20,000 a month, 80,000 is a 400% increase. For every foreclosure somebody from the lender has to show up and make decisions, the trustee has to show up and administer the auction and transfer the deed, perhaps there just aren't enough "somebody's" who understand the procedures to go round?
- There again it might be that the lenders could be trying harder to look for ways to modify loans so that foreclosure can be avoided; that takes time (putting together an offer, squaring it away - particularly if the loan is part of a pool and the pool has covenants, then getting an answer back from the borrower, perhaps negotiating).
- Or could it be that when a loan goes from "Non-current" to "loss" the banks or the service providers in the case of RMBS or CDO, have to book that number as a loss, not a provision? And that really messes up "mark-to-fantasy" accounting.
Which?
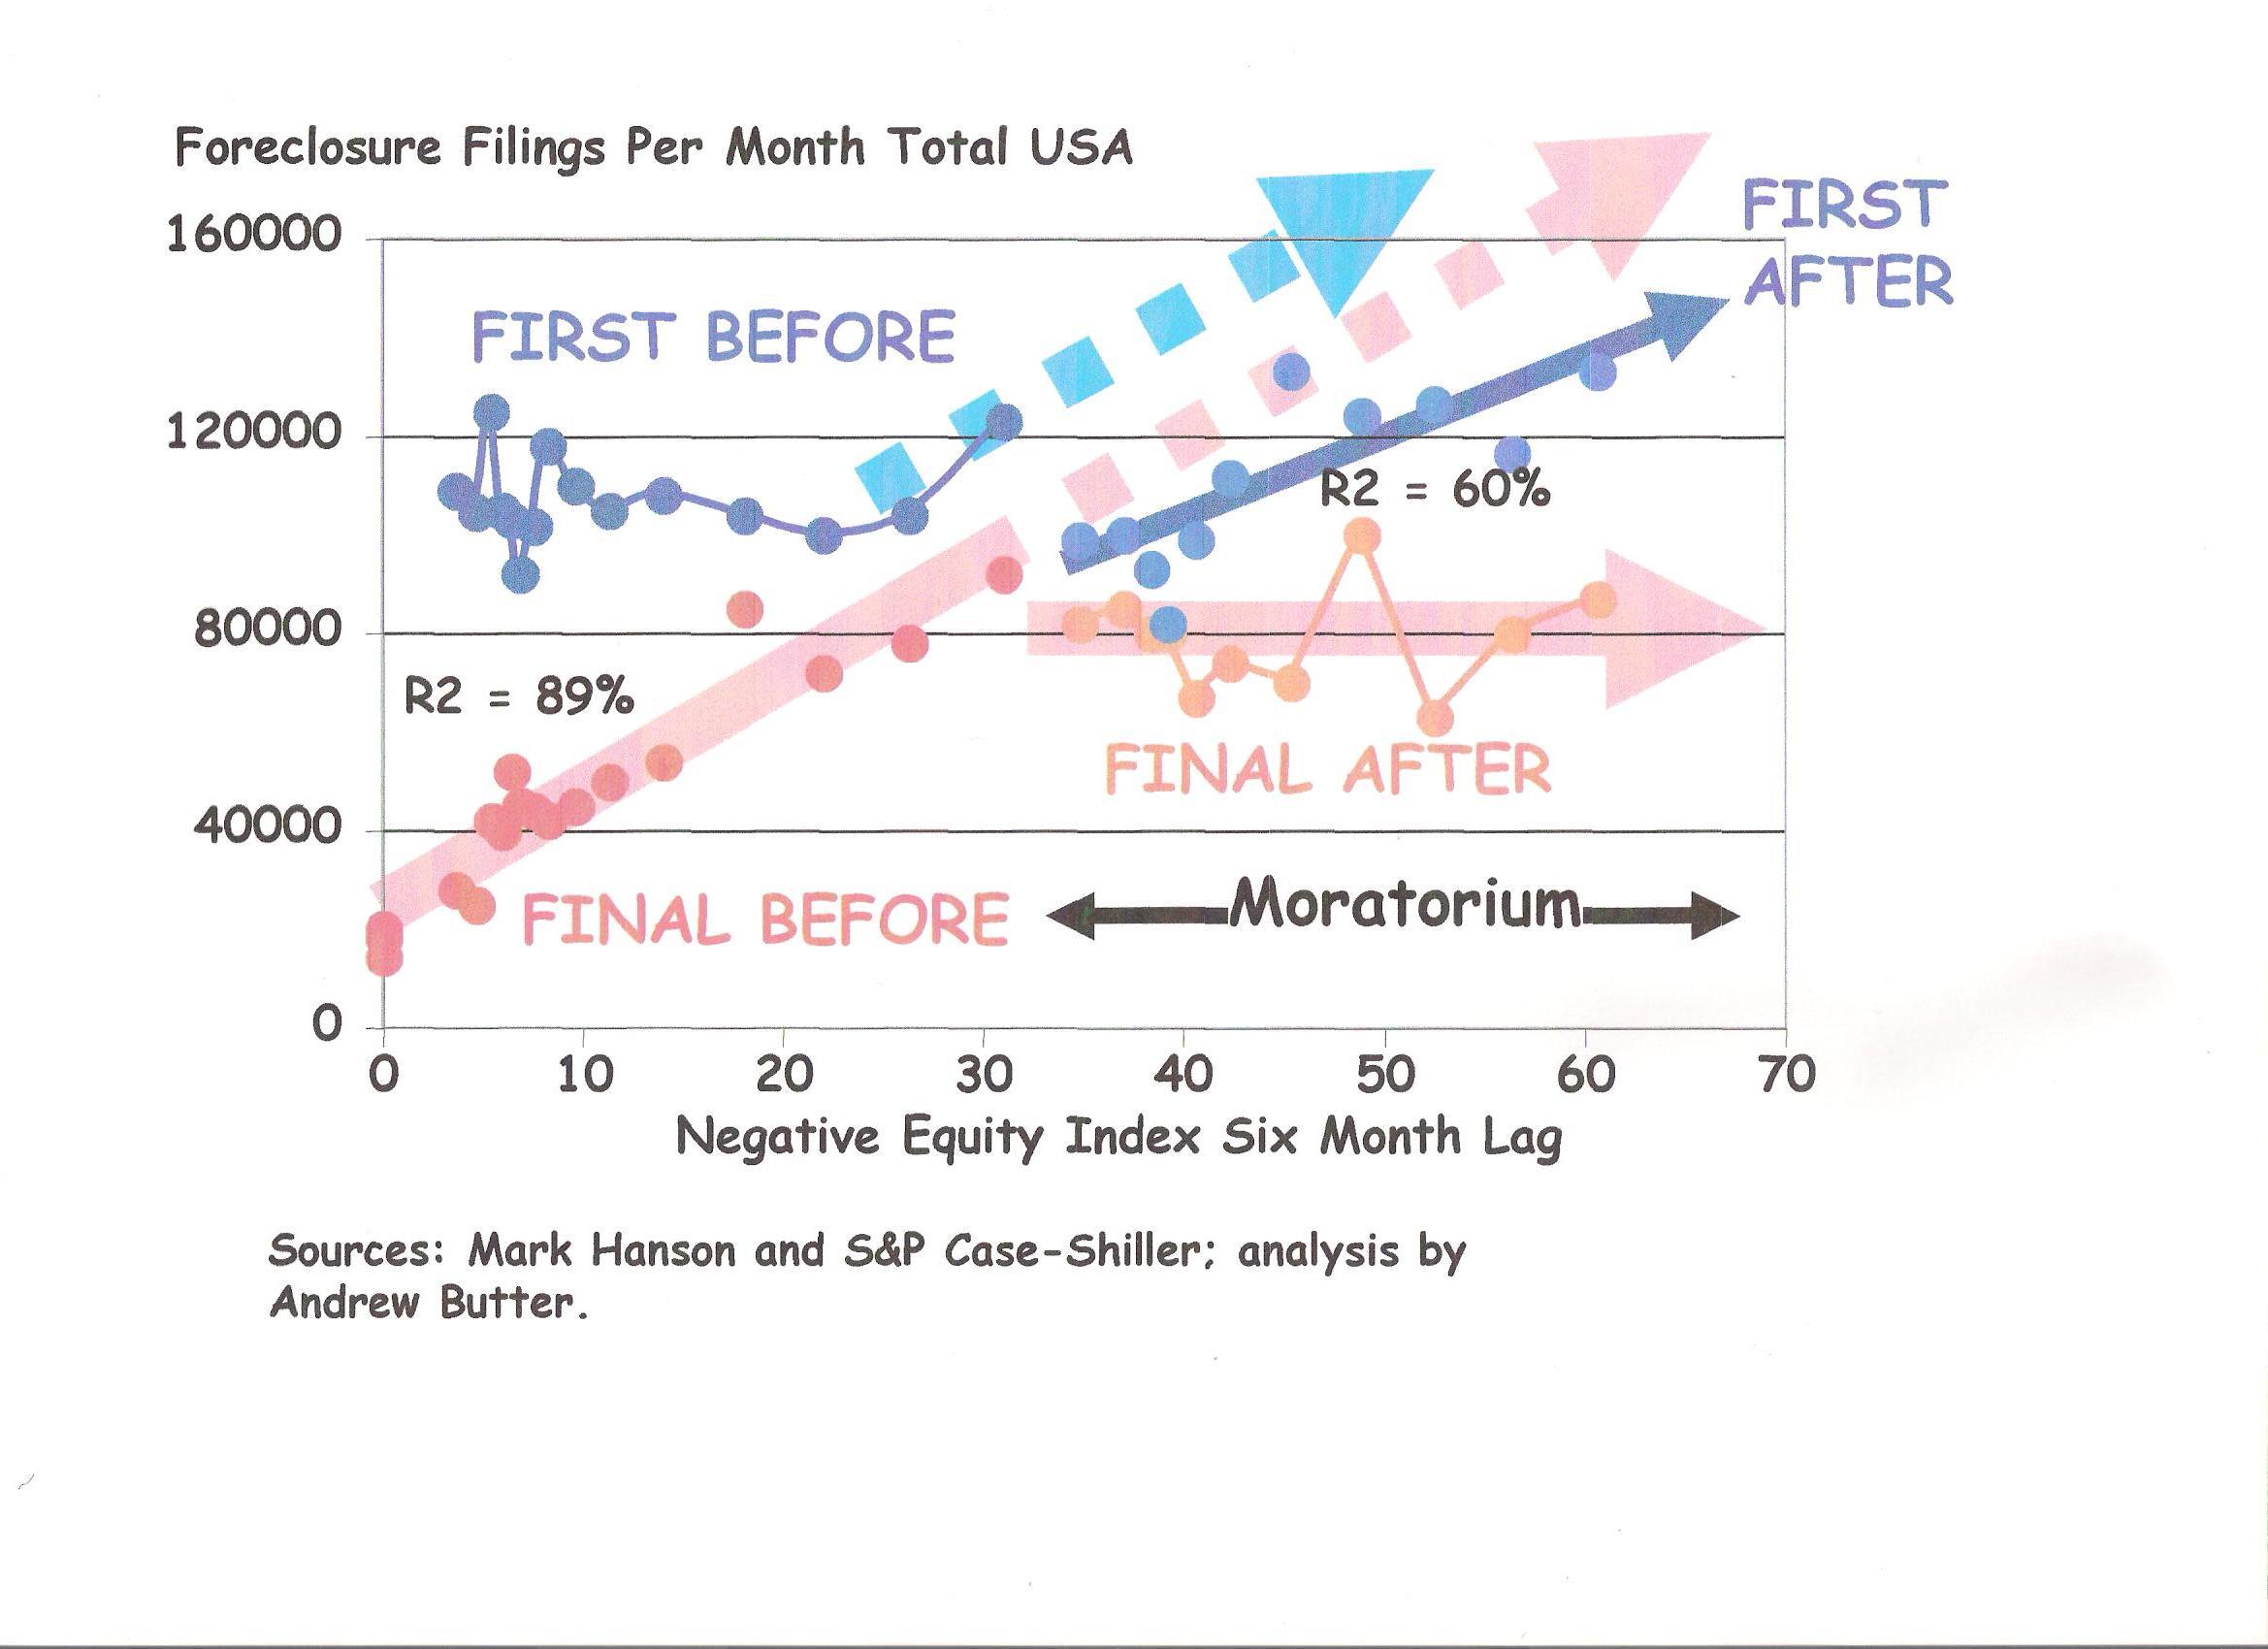
This is a plot of the difference between the S&P Case-Shiller 20 City Index and the final foreclosure number with a six-month lag, starting at the top where it was 207 (i.e. in January 2008 the Index was 181, so the difference is 26 and that's compared to foreclosures in June 2008 on the chart (six months later)). That's a measure of the Negative Equity of households.
This is the way I read that chart:
- There is clearly a relationship between Final Stage foreclosures and the amount of "negative equity"; also the moratorium had an effect, if the trend line had continued by now there would be 160,000 final foreclosures a month (assuming there had been enough capacity to deal with them), so in that sense the moratorium was a success, it "saved" 570,000 homes from foreclosure.
- It looks as if the moratorium also slowed down the number of 1st Stage filings which appear also to have stepped down from where they were headed in July and August last year, but are clearly driven by the "negative equity index", although thanks to the moratorium, the effect of that was from a lower base. So perhaps 400,000 1st Stage filings were "saved" there.
That appears to go against the theory that the moratorium encouraged or encourages people to default.
It's interesting how bankers, accountants and rating agencies never seem to miss an opportunity to blame their incompetence on the innate dishonesty, lack of personal ethics and downright crookedness of ordinary Americans, as if this whole thing was caused by Liar Loans, i.e. Liars. One of the turgid self-satisfied reports I read was about how the FBI "ought" to mobilize up to catch the people who "lied" as if that was what caused this disaster. Well I've met a lot of bankers, accountants and people from rating agencies, and I've also met a lot of ordinary Americans, and I don't think that I need to explain where my sympathies lie ( http://seekingalpha.com/article/157808-liar-loans-not-the-problem ) in that department. The track of the blue dots appears to prove my point.
It is likely also that easing off on foreclosures, was one, and perhaps the only reason for the recent "bounce" in the S&P Case-Shiller Index (helped perhaps by seasonal factors).
The Effect Of The Moratorium
The problem is that over the past nine months, despite the moratorium, another 1.2 million new 1st Stage Fillings were made, yet "only" 850,000 "left" the system to foreclosure, so that's another 350,000 in the system on top of the estimated 1,750,000 that were in the system in the first place (1st and 2nd Stage).
So that's 2,100,00 still "stuck" in the system, less the "cures", which are hard to gauge, I could not find consistent data on that.
Although if you have gone past the 1st Stage to once an auction date has been set (2nd Stage), the chances of modification or cure are much less; and from the first chart it is clear that the moratorium had little or no effect on the progression from 1st Stage to 2nd Stage. That suggests that unless new measures are brought in, the system might simply be playing catch up. "
Comments
This Blog entry currently has no comments.
Post a Comment
Please Log In
To use this feature you must be logged into your Lottery Post account.
Not a member yet?
If you don't yet have a Lottery Post account, it's simple and free to create one! Just tap the Register button and after a quick process you'll be part of our lottery community.
Register