
- Home
- Premium Memberships
- Lottery Results
- Forums
- Predictions
- Lottery Post Videos
- News
- Search Drawings
- Search Lottery Post
- Lottery Systems
- Lottery Charts
- Lottery Wheels
- Worldwide Jackpots
- Quick Picks
- On This Day in History
- Blogs
- Online Games
- Premium Features
- Contact Us
- Whitelist Lottery Post
- Rules
- Lottery Book Store
- Lottery Post Gift Shop


The time is now 1:47 pm
You last visited
July 20, 2026, 9:34 pm
All times shown are
Eastern Time (GMT-5:00)

A Pick 3 System Based On "Digits In Common With Previous Draws"Prev TopicNext Topic
-
-
-
"Every strategy I’ve come up with is ALMOST, but not quite, repeatable." That's because the
game is random. If you do the math you will find that the results are a product of the matrix
and nothing more. For this method to be useful the data needs to be predictable. Your first
step should be to test the randomness of the 3-digit patterns to see if they can be predicted
to some degree, you must consider that all 64 patterns are in play every game. Years ago
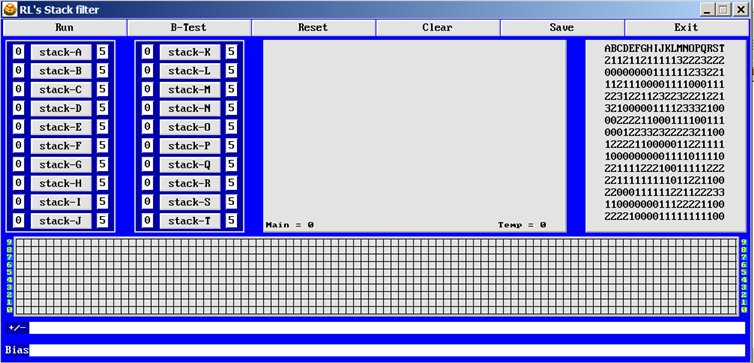
winsum asked about writing a program which was based on an idea he had and a old filtering
method that I had used in a older program. The filter was called "Stacks" at first but has been
renamed several times over the years. That tool does what you are doing here but expands
it to 20 levels. The user could set a range for how many numbers/ digits would repeat from the
previous game, then the previous previous game etc all the way up to 20 games. The data to
the right shows the history for each stack as to the number of digits/numbers came from those
draws. Steve and I had different views on the end product, his being it was a great filter which I
agreed but I had my doubts as the data was not predictable enough. I offered the tool here at LP
several times as a additional filter packaged with other tools but it never got much attention. The
historic data looks good but I found it almost impossible to predict without setting the stacks to
cover a wide range. The user could set any number of the stacks or bypass as needed looking for
the ones that showed / looked the most predictable for the next game. Each setting allowed a
range to be set. For example, lets say the first position was thought to be a 1 or 2 then both could
be played by setting the low range to 1 and the high range to 2.
Bottom line.
Unless the randomness breaks down when the method is applied then it's possible that the
odds will increase not decrease. Please don't think that I am trashing your attempts here,
I just think that you are not considering the combined odds for each step in the process. I am
getting old and the gray matter is not what it use to be but take it from someone who has
traveled down similar roads many many times. If the data is not predictable the method will
fail.
RL
....
-
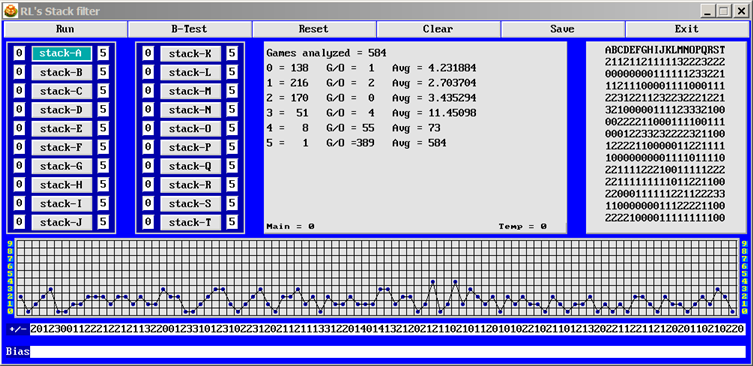
Here is another pic showing the analysis data for stack-A. This would be the number of digits / numbers
that repeat from the previous draw. I experimented using many different data collection as per the number
of games grouped into each stack. This tool now resides in the junk drawer with hundreds of other tools
that were almost but not quite.
RL
....
-
"Please don't think that I am trashing your attempts here"
Not at all RL, I appreciate your input! There's a reason those of us who have been part of LP for 10+ years are STILL here . . . that <snip> randomness will NOT be foiled!

-
....
-
-
-
-
mitachoo
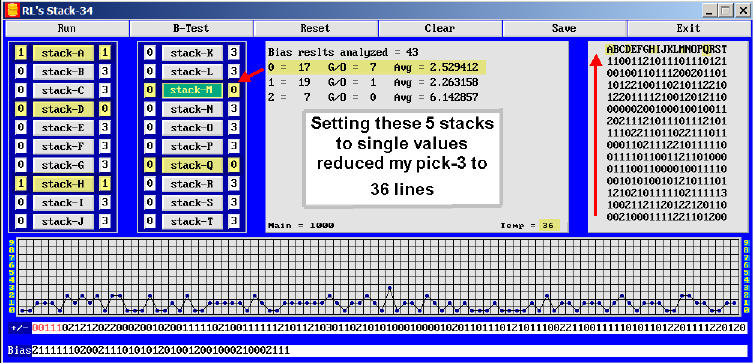
I made a few updated to the stack program and ran a mock setup setting 5 stacks to single values
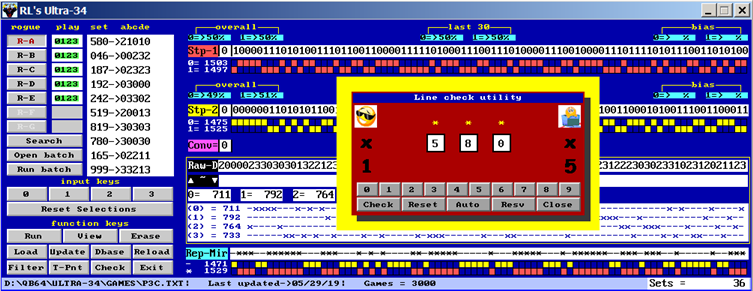
for my pick-3 game. The program reduced the matrix from 1000 to 36 lines and the second picture
shows the Ultra-34 check option with the results. Not bad at all provided one could hit the stack
values.
RL
Here are the results of the 36 lines, 1ea straight and 5-box hits.
....
-
-
-
-
-
