
- Home
- Premium Memberships
- Lottery Results
- Forums
- Predictions
- Lottery Post Videos
- News
- Search Drawings
- Search Lottery Post
- Lottery Systems
- Lottery Charts
- Lottery Wheels
- Worldwide Jackpots
- Quick Picks
- On This Day in History
- Blogs
- Online Games
- Premium Features
- Contact Us
- Whitelist Lottery Post
- Rules
- Lottery Book Store
- Lottery Post Gift Shop


The time is now 3:36 am
You last visited
May 2, 2024, 2:49 am
All times shown are
Eastern Time (GMT-5:00)

Ohio: 2/1 - 2/29/2024Prev TopicNext Topic
-
Quote: Originally posted by Keemdreambean on Feb 15, 2024
When I notice certain trends
I try and alert everyone as best
as possible
45 or 86 should come back on eve sometime this week that's a fact
95 is possible to be seen again as well
Like that confident

Fri, Feb 16, 2024
6-8-2
King of Kings Ozymandias am I. If any want to know how great I am and where I lie, let him outdo me in my work."
-
As the great Bob Ross would say there are no mistakes , just happy little accident's
EASY MONEY SNIPER 🎯
-
As the great Bob Ross would say there are no mistakes , just happy little accident's
EASY MONEY SNIPER 🎯
-
-
-
X15-0879
-
As the great Bob Ross would say there are no mistakes , just happy little accident's
EASY MONEY SNIPER 🎯
-
210,214,215,402,254 (pet numbers)
-
210,214,215,402,254 (pet numbers)
-
-
X15-0879
-
 BOX HIT WINNER!Austintown, Ohio
United States
Member #125,133
March 25, 2012
1,163 Posts
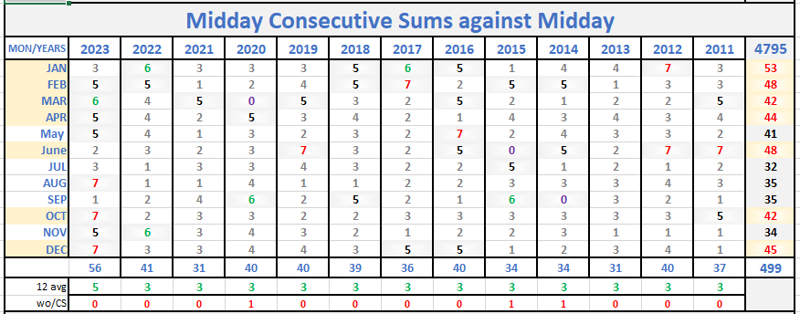
OfflineFor Jinjuan and Ohio players in this thread who may be interested in the occurrence of Consecutive Sums being drawn across the
- Midday to Midday game, the
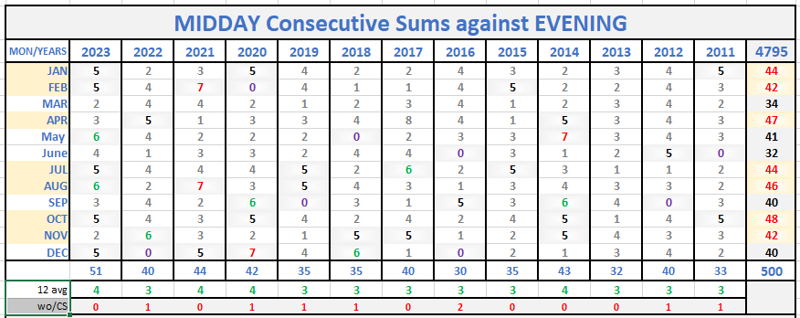
- Evening to Evening game, and the
- Midday to Evening games
My thoughts are this,
- First, I thoroughly enjoyed tracking your idea of CSums. I used ChatGPT to help me with the formulas to do this task, so I learned something new and thats always fun. Moreover,
- it was eye opening to see just how often each month this does occur across the games, Jinjuan. I will add the counts below for your review.
- Consecutive sums are showing up some 3 times a month at the least if not more; and each of the three groups. You'll notice, that they bulk up near the beginning of the quarters; which makes me think this could be how they load up their lottery coffers we they need it. Yep, I said that 'outloud'.
- I will certainly be applying what I found looking at consecutive Sums moving forward, Jinjuan--and I thank you for bringing it to my attention.
How I completed the task of counting Consecutive Sums
Below is a screen shot of my Excel WB that has the Ohio Pick 3 draw results from 2011 up to the present. To do this task, I added 5 more 'helper' columns to work up the formula that would return a count of 1 if it found a consecutive sum. I needed two columns to do the Mid to Mid games by using a count for 1 up and another column for 1 down. Same for the Eve to Eve, and of course, logically, the Mid to Eve only needed one column as I was able to use a different formula to count both one up and one down. Then I created a few pivot tables to collect the counts and produce the charts below.
The numbers are showing that after 4795 draws since 2011 the consecutive sums occur somewhere around 10% of time which seems disappointing to learn, but when you count them month to month, year to year, you certainly see the averages panning out for their occurrence. sometimes you just got to break thing down into time lines to see what they tell ya. anyhoo,
If you could scroll through all the pages from 2011 to 2023 you would notice that these CSum occurrences (columns BI thru BM) happen in groups with runs of 30 days or longer where it doesn't not happening---Which is why you will see some zeros in the other charts below this chart when we count how many times each month CSums occur.
Let me know if you, or anyone else, reading this has any questions or need for clarity.

These charts below demonstrate how many times a month, across the last 13 years did Consecutive Sums presented themselves in the Draws Games. The numbers are suggesting that we can expect consecutive sums to be draw at least 3 times a month; and that by keeping track of when they do, could very well help to determine when again their due. Just like all the other dues we expect to happen.

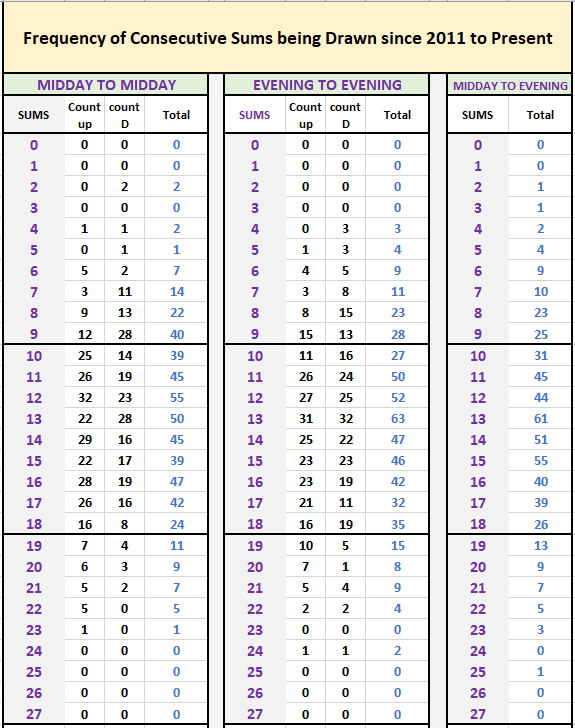
This is a count of those consecutive sum occurrences for each of the 27 Sums.
-
BOX HIT WINNER!Austintown, Ohio
United States
Member #125,133
March 25, 2012
1,163 Posts
Offline Nice, Member! Glad you had a winning ticket!
 -
X15-0879
-


