
- Home
- Premium Memberships
- Lottery Results
- Forums
- Predictions
- Lottery Post Videos
- News
- Search Drawings
- Search Lottery Post
- Lottery Systems
- Lottery Charts
- Lottery Wheels
- Worldwide Jackpots
- Quick Picks
- On This Day in History
- Blogs
- Online Games
- Premium Features
- Contact Us
- Whitelist Lottery Post
- Rules
- Lottery Book Store
- Lottery Post Gift Shop


The time is now 8:09 am
You last visited
July 19, 2026, 9:32 pm
All times shown are
Eastern Time (GMT-5:00)

Lottery Analysis Tools .Prev TopicNext Topic
-
-
-
Have an EXCELlent day!
-
-
Have an EXCELlent day!
-
Have an EXCELlent day!
-
-
-
-
-
-
- Saying Lotto #s Can be Predicted means that Lotto's ODD can be reduced down to an economical level by a system.
- Saying a Lotto System Works means that we can win constantly (not each draw) and economically (get a real profit) by using the System.
- Practice is the only criterion for testing truth.
-
Good Luck everyone
-
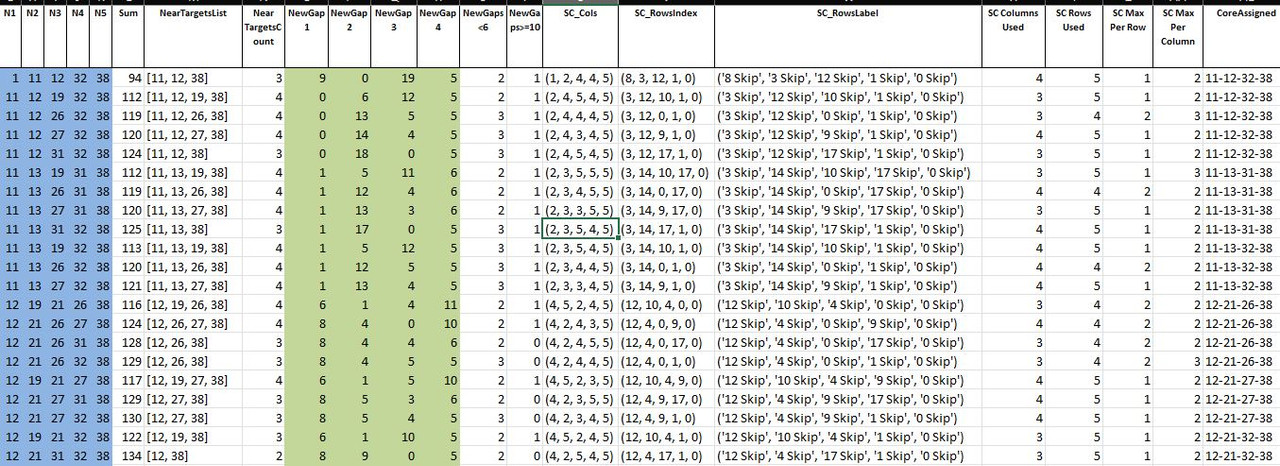
Here's a file created by chatgpt. This is after I enter a group of numbers and filters. It really breaks down the lines for you. From left to right.
Five lottery numbers sorted from lowest to highest. Sum, Target numbers:These are numbers within 2 of the last draw. Gap between each number. 1 to 11 is a gap of 9 for me. It's 11-1=10- then -1=9. So 11/12 is 1 -1 =0. Gaps <6....Gaps 10 or greater. Skip chart columns. skip chart Rows. Then skip over to where it shows 4 5 1. Skip Chart Columns used, rows used, Max per row and column. You can add key numbers. You can say each line must include 2 of the following five numbers. If you have your home grown program or software and you know what filters win more often. You can focus on lines that only have those filters. Of course you have to have all five numbers in your group to get the jackpot. But eliminating bad overall lines is the way to go imo.
GET IT DONE
-
 Stat$talker700 light yrs West of Milky Way Galaxy's Center
United States
Member #200,634
September 1, 2019
5,617 Posts
OfflineCmoore50? Haz CHATGPT helped mproved yo hitz?
We wanna Cmoore50z


