
- Home
- Premium Memberships
- Lottery Results
- Forums
- Predictions
- Lottery Post Videos
- News
- Search Drawings
- Search Lottery Post
- Lottery Systems
- Lottery Charts
- Lottery Wheels
- Worldwide Jackpots
- Quick Picks
- On This Day in History
- Blogs
- Online Games
- Premium Features
- Contact Us
- Whitelist Lottery Post
- Rules
- Lottery Book Store
- Lottery Post Gift Shop


The time is now 9:17 am
You last visited
July 20, 2026, 9:34 pm
All times shown are
Eastern Time (GMT-5:00)

Florida Scratch Offs - Post Pictures if posiblePrev TopicNext Topic
-
-
-
-
Hi Ed,
The odds were 1 in 672,000 on winning $100k on the Super Millions game I believe. The new $10 game is a better bet for that prize tier. I've seen piles of duds, and snagged about 10-15 to enter into the second chance drawing the other day. (To answer your post on the previous page)
As far as your discovery of this new $30 game, this looks exciting. I sometimes look at Instant Liability Reports to get a "sneak peek" of what new games are coming out too. It looks like the FL Lottery is finally releasing another game worth playing, like the $25 World Class Cash. I'm going to hold off on playing these new tickets, in anticipating of that new $30 ticket. With 155 total $1M prizes, the odds should be much better than any game we've seen.
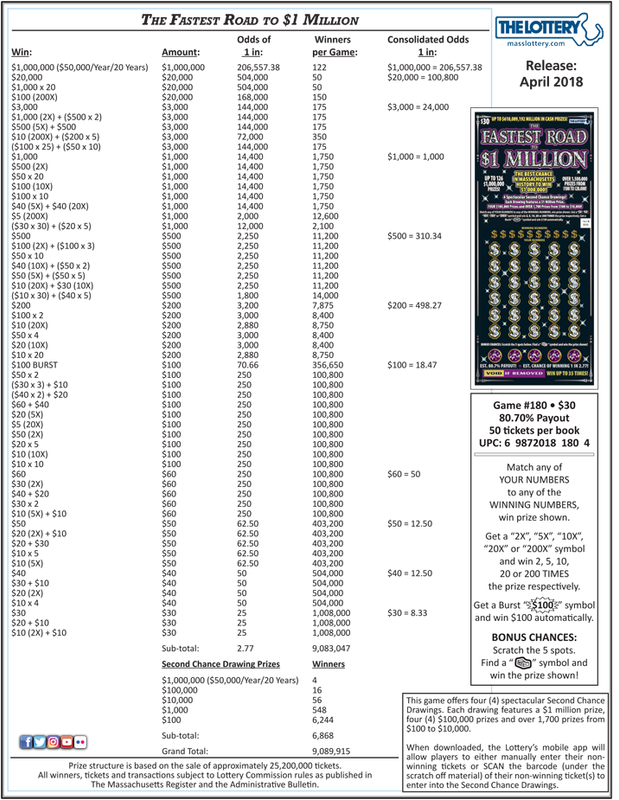
Wishful thinking...but It sounds like it is similar to the Massachusetts $30 game. 1 in 206.6k odds at winning $1M. Better odds than winning the Fantasy 5 (albeit, at the $30 price point). I don't remember the odds on the holiday millionaire raffle, but I think this game will be interesting to play. I'm curious to see what the FL Lottery's odds will be for the $1M prize. I wouldn't mind if there were a $10m or $15M prize with odds in the 1 in 20M range, if the $1M prize were in the 1 in 200k-400k range. I'd prefer a mix of games, ones out there that offer chances at winning the super massive jackpots (like the $15M on the recent $30 games), and then games out there structured like the one below that has a lower than typical jackpot prize but incredibly good odds.
-

-
20K World Cash Class - 10K JUBILEE - 5K $200 Million Dollar Spectacular ... 57 1K's
615 500's 9 400's
-
-
$100
-
-
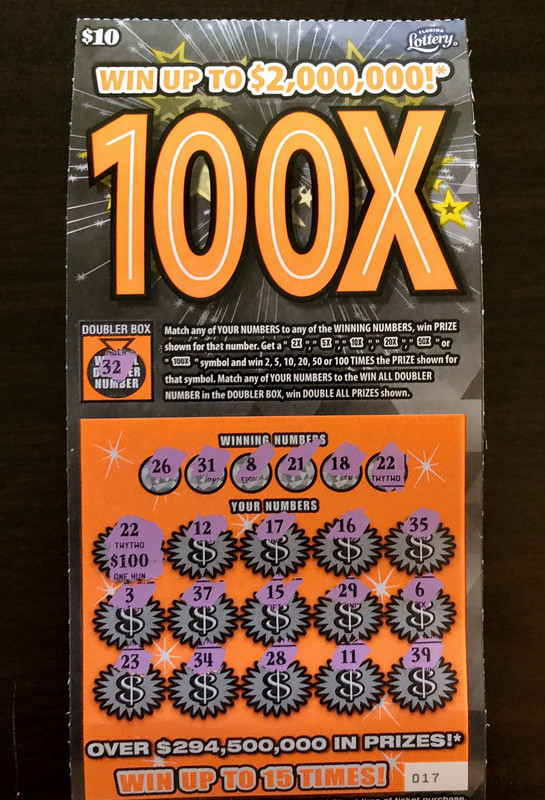
Got one of the new 50x and one of the 100x tickets today. The 50x was not a winner but the 100x has the doubler win all number match for $100:

-
-
-
-
-

